|
Molecular Dynamic Simulation for MXn Clusters |
|
References:
D. Prekas, Ch. Lüder and M. Velegrakis, ” Structural transitions in metal-ion-doped noble gas clusters: Experiments and molecular dynamics simulations”, J. Chem. Phys. 108, 4450 (1998) |
|
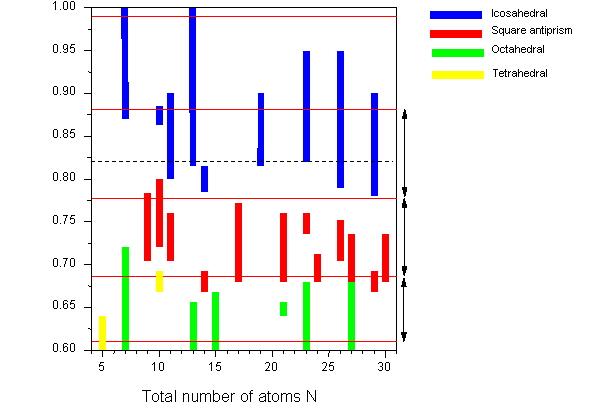
Bar graphs representing the second difference Δ2E(N) of the total binding energies E(N) calculated for ε*=10 and for several values of σ* ranging from 0.9 to 0.73. The different shadings refer to the several geometries as indicated. |
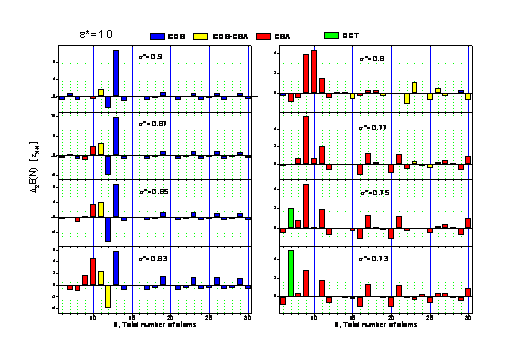
|
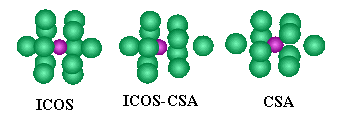
“Phase” diagram showing the magic numbers and the geometries expected for clusters of the type M+Xn with ε*=10. The dotted line at σ*=0.82264 is the maximum size ratio for CSA geometry as predicted from the hard sphere model. |